How to make your website go FAST and buttery SMOOTH
Performance is crucial when it comes to providing a good user experience. In an age of smartphones and speedy internet connections, users have little to no tolerance for a bad UX.
First impressions mean everything, so if your site takes longer than necessary to load, it could mean one less sale or customer for your business.
So how do we obtain that coveted, green, 100% Lighthouse performance score?
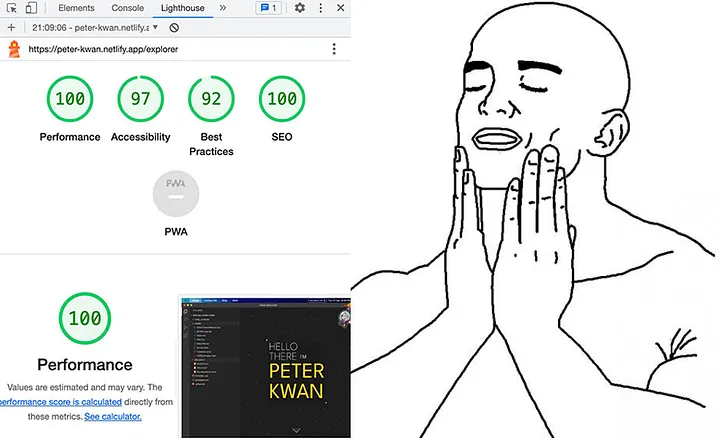
Lately, I’ve been working on my personal website (still in beta!). I’ve never paid attention to performance since I started the project last year, so naturally, I was curious when I stumbled across the Lighthouse developer tool.
I decided to run a quick test. Below were the results.
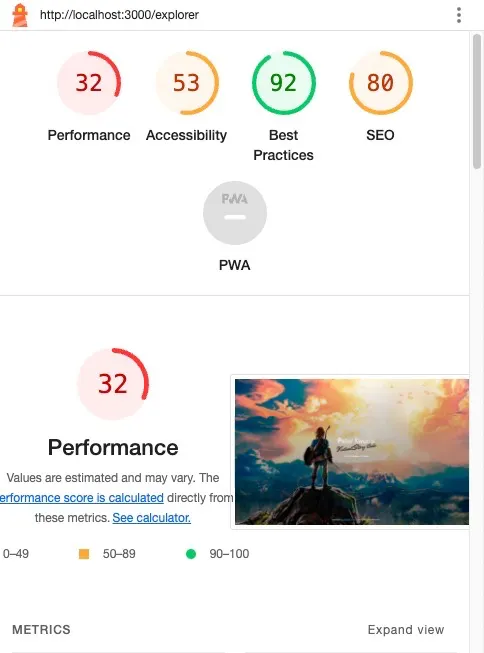
Needless to say, I was not happy with these scores! I started digging around to see what was going on under the hood, specifically for performance.
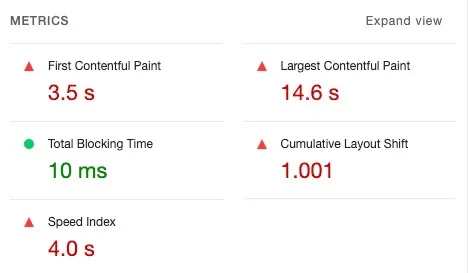
According to the Lighthouse performance weightings, Cumulative Layout Shift (CLS) and Largest Contentful Paint(LCP) were dragging my performance rating down. What is going on?
Let’s try to improve my site by tackling these two metrics.
Cumulative Layout Shift (CLS)
CLS is a measure of the largest burst of layout shift scores for every unexpected layout shift that occurs during the entire lifespan of a page. These shifts are usually due to font changes, images without dimensions or ads, embeds, and iframes without dimensions.
To figure out which elements where affect the CLS score, I hopped over to the Performance tab. It turns out, it was my title header that was causing the shift.
Hello there
I'm Peter Kwan
It looks like you are viewing my site on a tablet or mobile device
Please view my site on a desktop computer* to get the full experience
*Screen pixel width should be at least 1024px